
02 / PLATFORM
Soren terminal
On a computer, the market list, chart, order form and portfolio share one workspace. On a phone, dedicated markets, trading, portfolio and account screens give each task room.
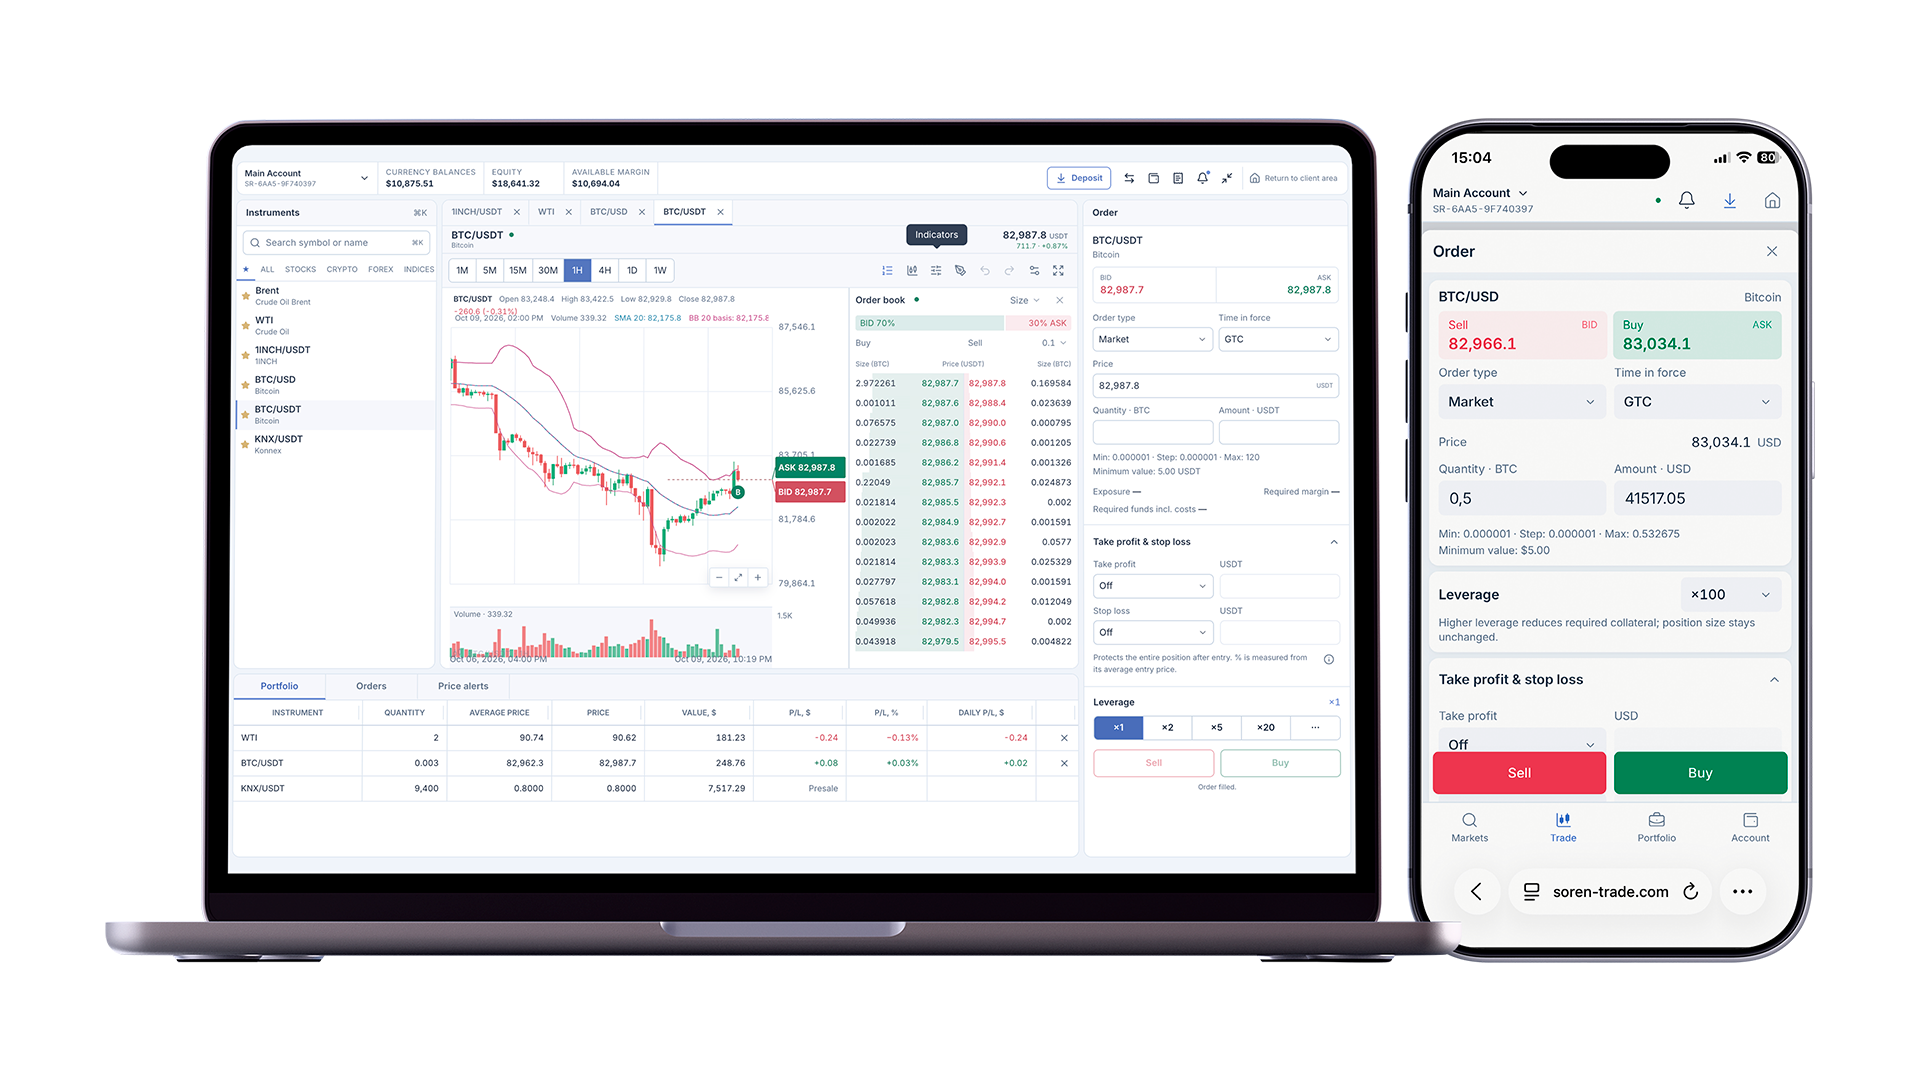
The workspace
Keep the instrument and its market context together while moving between views.
Search, favourites and tabs
Search by ticker or name and filter by market category or favourites. On a computer, instruments, the account and transactions open in separate workspace tabs, so another chart can stay open while you switch views.
Quote context
Buy and sell prices, their spread, market status and observation time provide context for the displayed price. A closed session, an older observation and unavailable data are shown as distinct states.
Order book
For instruments with market depth, view buy and sell quantities by price level. Adjust the price grouping step and choose individual or cumulative quantities to change how the depth is presented.
Charts and analysis
Change the view of the price, add calculations and keep your own marks on the chart.
Periods, views and scale
Choose 1, 5, 15 or 30 minutes; 1 or 4 hours; a day or a week. Display candles, bars, a line or an area. Zoom through history, switch between linear and logarithmic scales, use autoscale or return to the current price.
Technical indicators
SMA, EMA, Bollinger Bands, RSI, MACD and ATR are available, with volume where the instrument has volume data. Adjust periods, price inputs and indicator-specific settings, as well as colour and line width; hide a calculation without removing it.
Drawings and saved settings
Add trend, horizontal and vertical lines, rays, rectangles, Fibonacci levels, text and price markers. Move, hide or lock drawings and undo or redo edits. Chart settings and drawings are saved for each instrument in the browser you use.
Order parameters
Size, execution conditions and calculations are shown together in the order form.
Order type and validity
Available types include market, limit, stop, stop-limit and trailing stop. The form offers the types supported by the instrument and their price or trailing-distance fields. Validity options include GTC, DAY and IOC; the available combination depends on the order type and instrument.
Size, margin and costs
Enter quantity or, where supported, an amount. The form shows position value, required margin, reserved funds and estimated commission. Changing available leverage changes the margin required; profit or loss depends on position size and price movement.
Take-profit and stop-loss
For supported orders, enter a target price or percentage and review the calculated profit or loss at those levels. Existing protection orders appear in the form with a cancellation control. Execution depends on available prices; a stop-loss does not guarantee the chosen execution price.
Portfolio and history
Review what you hold, what has executed and which operations are recorded on the selected account.
Position details and trade markers
Expand a position to inspect its quantity, average price, value and profit or loss, or open its event history. Executed trades can also appear as chart markers: their notes show the time, quantity and execution price, and distinguish opening, increasing, reducing or reversing a position.
Price alerts
Set an instrument, buy or sell quote side, threshold price and condition. The signals list distinguishes active alerts from triggered ones; an alert follows the selected quote condition rather than placing a trade.
Account transactions
Filter recorded operations by date, operation type, instrument, description, quantity and amount. History is shown in pages of 10 records with previous and next controls. On a computer, adjust table column widths to fit the details you want to read.